How to use the Report controls to build a Report Dashboard
KB001428
PRODUCTK2 smartforms 1.0.6
BASED ONK2 smartforms 1.0.6
LEGACY/ARCHIVED CONTENT
This article has been archived, and/or refers to legacy products, components or features. The content in this article is offered "as is" and will no longer be updated. Archived content is provided for reference purposes only. This content does not infer that the product, component or feature is supported, or that the product, component or feature will continue to function as described herein.
| Audience |
|
| Required Knowledge |
|
Introduction
This Knowledge Base article describes how to use the Report controls released with the K2 smartforms Control Pack. Report controls are available in the K2 smartforms View Designer and Form Designer and consist of predefined reports that provide status and statistical data on workflows. It is essential to have existing K2 workflow instances when using these controls as the data returned in the reports is based on workflow-related data. Data returned can be displayed in the form of Charts or Grids and filters can be configured in design time, to be applied at runtime. A Report Header control can be used to filter these Charts or Grids further at runtime. Rules should be created to manage interaction between these controls.
Implementation Details
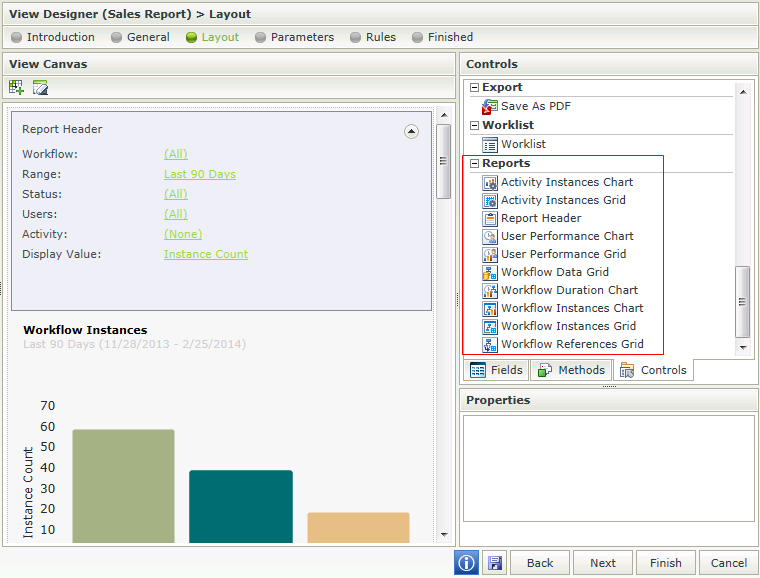
The following Report controls are available:
- Report Header - Contains common properties that can be used to filter Charts or Grids added to the View
- Activity Instance Chart - Graphic display of workflow activities according to the specified filter criteria
- Activity Instances Grid - Lists all activity instances of a workflow according to the specified filter criteria
- User Performance Chart - Graphic display of users who have participated in the selected activity according to the specified filter criteria
- User Performance Grid - Lists the users who have participated in the selected activity with activity data according to the specified filter criteria
- Workflow Data Grid - Lists all Data Fields per workflow instance according to the specified filter criteria
- Workflow Duration Chart - Graphic display of the average duration of workflow instances over time according to the specified filter criteria
- Workflow Instances Chart - Graphic display of workflows according to the specified filter criteria
- Workflow Instances Grid - Lists all workflow instances according to the specified filter criteria
- Workflow References Grid - Lists all Workflow Item References per workflow instance according to the specified filter criteria
Example
In the scenario below we will be using the Report controls to create a dashboard which will organize and present workflow information in a way that is easy to read. Users will be able to view workflow related information and interact with the controls. It is important to note that existing workflow instances are required to report on. We are using a Sales scenario and have multiple instances in various states of completion. We are using the following controls on the Sales Report:- Report Header
- Workflow Instances Chart
- Workflow Instances Grid
- Activity Instances Grid
- User Performance Grid
- Workflow Data Grid
- Create a blank View.
- Drag the controls mentioned above onto the design canvas.
- Place the controls on the design canvas and customize the properties of each control in a way that would make sense to the business. More information about the different properties per report control can be found in the K2 smartforms Control Pack Online Help. Alternatively use the defaults to just view the execution at runtime. We are using the defaults in our scenario.
- Navigate to the Rules and add the following rule:
Events: When the View executes a method
Actions: Execute a control’s method (Add this action 5 times and select each of the report controls and methods as shown below)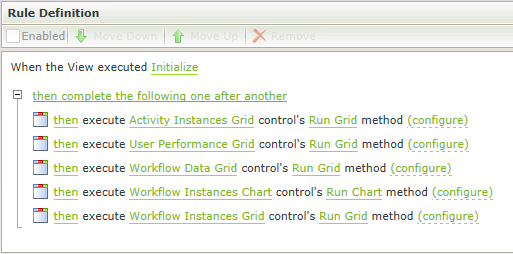
- Click Finish to save the rule.
- We want to use the Date Range property of the Report Header to apply the same date to all reporting controls. When changing the Date Range in the Report Header, the same range will automatically be applied to the rest of the controls. Create the following rule:
Events: Execute a method on the View when a control raises an event (Report Header is changed)
Actions: Execute a control’s method (Add this action 4 times and select each of the report controls and methods as shown below). The Workflow Data Grid is not listed here as it does not have a Date Range property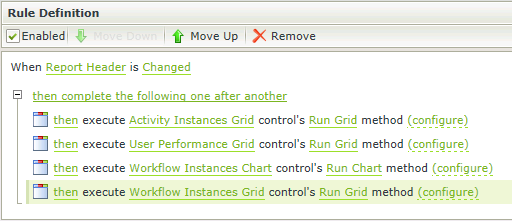
- Configure the Properties of each action as shown below:
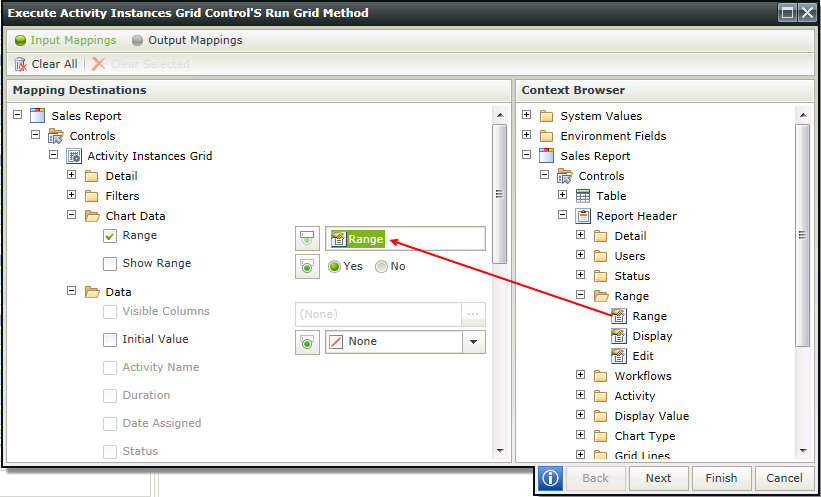
- Save the rule.
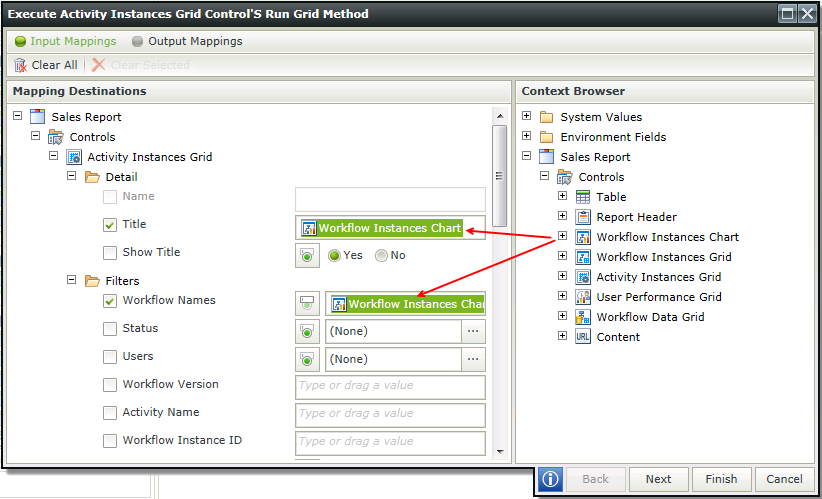
- Next we want to create a rule that will populate the Activity Instances Grid with the related information when clicking on a workflow instance in the Workflow Instances Chart. We will also set the Title of the Activity Instances Grid with the name of the workflow. Create the following rule:
Events: When a control on the View raises an event
Actions: Execute a control’s method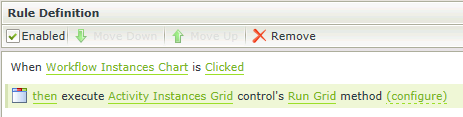
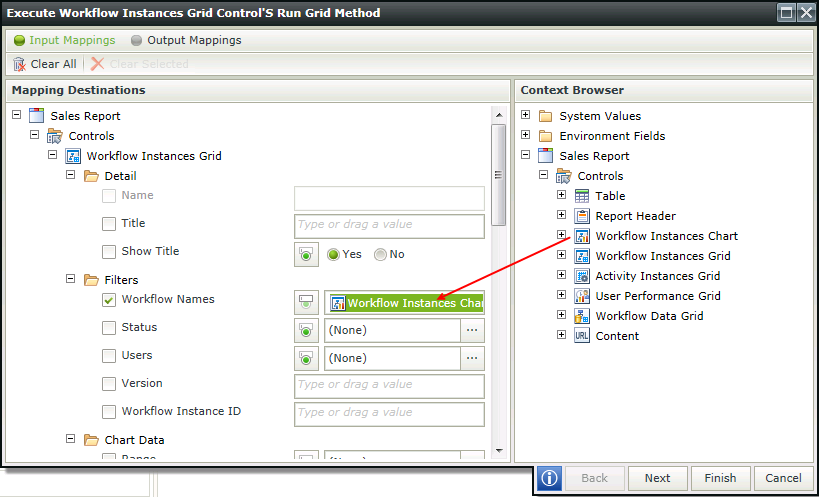
- Click on configure next to the action and map the Workflow Instances Chart to the Title and Workflow Names properties of the Activity Instances Grid.
- Click Finish to save the configuration.
- We also want to populate the Workflow Instances Grid with the related information when clicking on a workflow instance in the Workflow Instances Chart. Add another action for the Workflow Instances Grid as shown below:
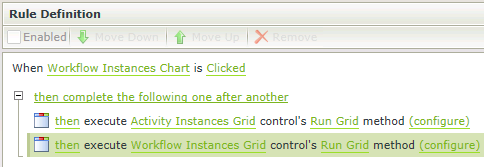
- Click on configure next to the Workflow Instances Grid action and map the Workflow Instances Chart to the Workflow Names filter of the Workflow Instances Grid
- Click Finish to save the configuration and Finish to save the rule.
- When clicking on the Activity Instances Grid, the User Performance Grid should be populated with the activity selected in the Activity Instances Grid. Create the following rule:
Events: When a control on the View raises an event
Actions: Execute a control’s method
Note: When executing this rule at runtime, only users who have completed that specific activity of the workflow instance will be reflected. If no users have completed an instance of the activity, no data will be returned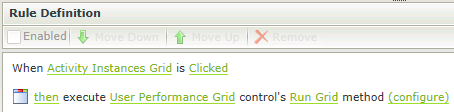
- Click on configure next to the User Performance Grid action and map the Full Activity Name of the Activity Instances Grid to the Activity Name filter of the User Performance Grid
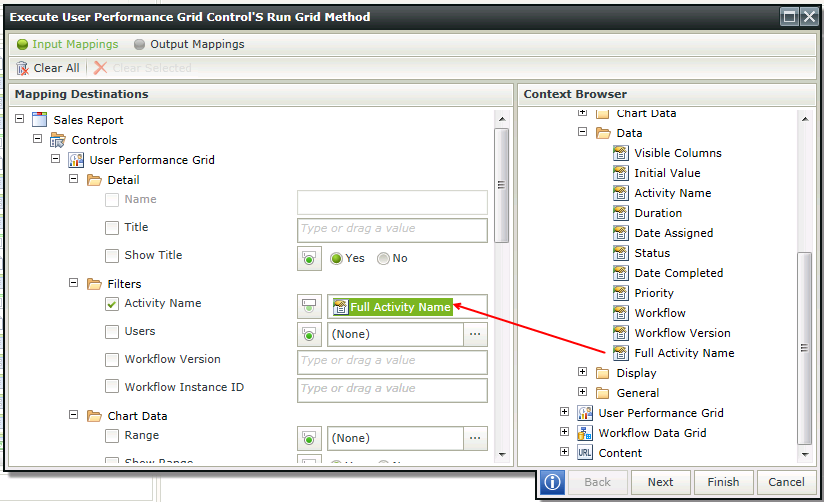
- Click Finish to save the configuration and Finish to save the rule.
- When clicking on an instance in the Workflow Instances Grid, we want to see the Data Fields linked to that specific instance. We also want to update the Activity Instances Grid and User Performance Grid with the selected workflow instance. Create the following rule:
Events: When a control on the View raises an event
Actions: Execute a control’s method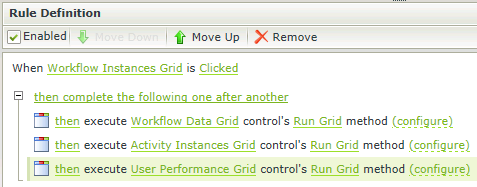
- Click on configure next to the Workflow Data Grid action and map the Workflow Instances Grid to the Workflow Instance ID of the Workflow Data Grid
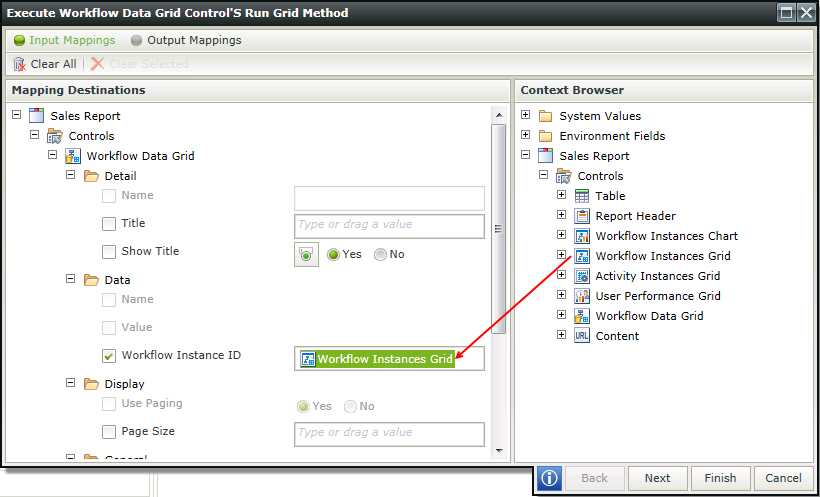
- Click Finish to save the configuration.
- Click on configure next to the Activity Instances Grid action and map the Workflow Instance ID of the Workflow Instances Grid to the Workflow Instance ID filter of the Activity Instances Grid
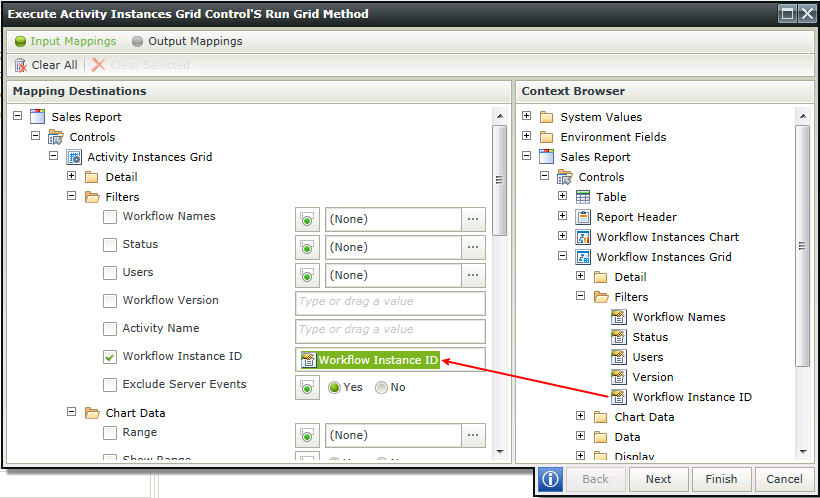
- Click Finish to save the configuration.
- Click on configure next to the User Performance Grid action and map the Workflow Instance ID of the Workflow Instances Grid to the Workflow Instance ID filter of the User Performance Grid
Note: When executing this rule at runtime, only users who have completed that specific activity of the workflow instance will be reflected. If no users have completed an instance of the selected workflow, no data will be returned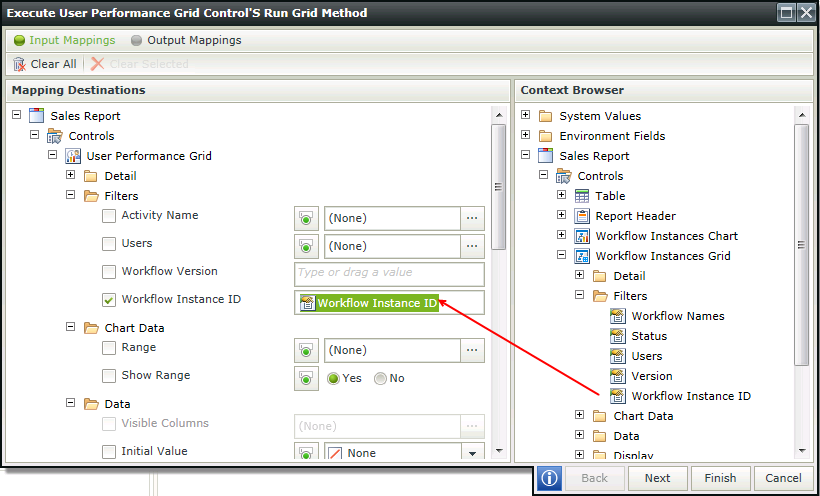
- Click Finish to save the configuration and Finish to save the rule.
- Click Finish to save the View.
- Ensure that you have enough workflow instances started and completed to return proper data.
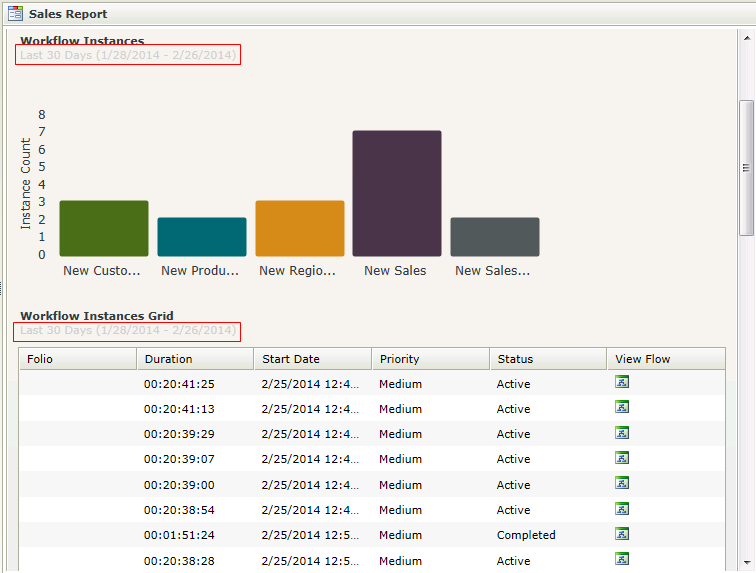
- Run the View
- Change the Range of the Report Header. Note how the changes are applied to the Workflow Instances Chart, Workflow Instances Grid, Activity Instances Grid and User Performance Grid
- Click on a workflow instance in the Workflow Instances Chart. Note how the Workflow Instances Grid and Activity Instances are updated and the title of the Activity Instances Grid is changed.
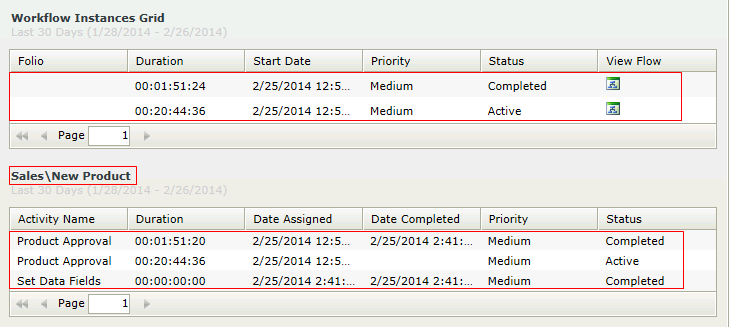
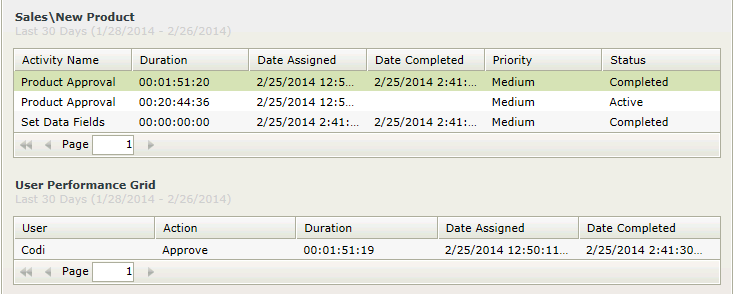
- Click on an activity with a Completed status in the Activity Instances Grid. Note how the User Performance Grid is updated with the activity selected in the Activity Instances Grid
- Click on an instance in the Workflow Instances Grid. Note the related Data Fields in the Workflow Data Grid and the updated information in the Activity Instances Grid and User Performance Grid.
Note: If no users have completed the specific activity of the workflow instance, no data will be returned in the User Performance Grid.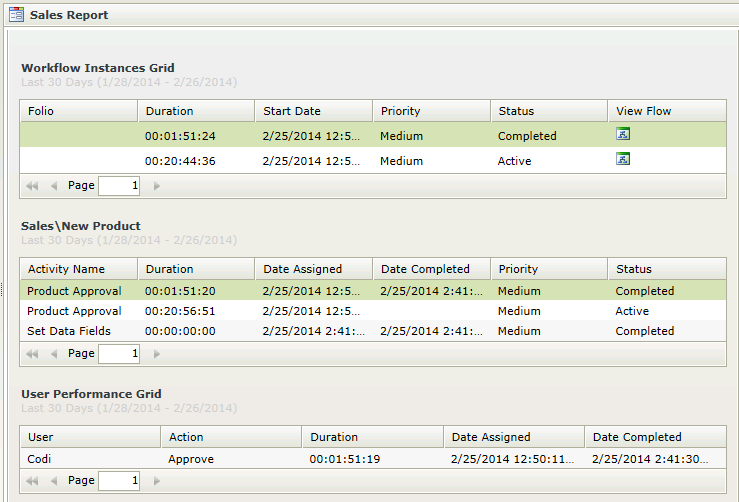
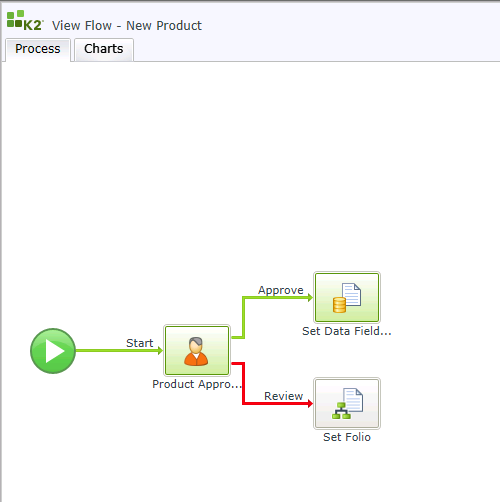
- Click on the View Flow icon of an instance in the Workflow Instances Grid. The View Flow opens in a new tab and shows the route followed for the specific workflow instance.